Dividend Tracking & Reinvestment
Turn Every Dividend Into More
Reinvesty gives dividend investors one intelligent platform to track income, visualize compound growth, plan cash flow, and make data-driven reinvestment decisions — automatically.

Reinvesty gives dividend investors one intelligent platform to track income, visualize compound growth, plan cash flow, and make data-driven reinvestment decisions — automatically.

Dividend investing is a long game — and it rewards discipline, patience, and precision. Yet most investors are managing their dividend portfolios with tools that were never built for the job.
Spreadsheets feel flexible, but they quickly become a liability. As your portfolio grows across multiple accounts and brokers, manual tracking creates fragmentation, introduces human error, and makes it nearly impossible to calculate nuanced metrics like yield-on-cost or forward income projections without significant maintenance overhead.
Focusing only on raw dividend income gives you an incomplete — and sometimes dangerously misleading — picture of your portfolio’s health. Reinvesty tracks everything that matters.
Your baseline cash flow metric — the actual dollars your portfolio generates each month, quarter, and year. Reinvesty aggregates payments across every account automatically, categorizing ordinary and qualified dividends for both strategic and tax purposes.
Reliable income streams prove their value most during market downturns, when capital gains are difficult or impossible to achieve. Knowing exactly how much cash your portfolio generates — independent of price movements — is the foundation of dividend investing.
Perhaps the most powerful metric in a long-term dividend investor’s toolkit. Yield on cost measures your annual dividend income relative to your original cost basis — and it grows over time as dividends are reinvested and companies raise their payouts.
A position purchased with a 3% yield that has grown its dividend at 8% annually for a decade now yields over 6% on your original investment — even if the stock’s current yield looks modest to new buyers. This compounding effect is invisible in yield-only views.
Dividend income alone can be a misleading headline number. A stock with a 6% yield and stagnant share price delivers a 6% total return — while a 2% yielder appreciating at 10% annually generates 12% total return over the same period.
Sustainable wealth building requires both dimensions. Reinvesty tracks total return alongside dividend income, ensuring you’re optimizing for actual wealth creation rather than just maximizing yield. A balanced portfolio includes high-yield stable payers and lower-yield, higher-growth holdings.
A dividend is only as reliable as the business backing it. Payout ratio — the percentage of earnings distributed as dividends — tells you whether a company’s dividend is sustainable or stretched. Companies with low payout ratios, steady free cash flow, and conservative management tend to grow dividends for decades.
Dividend cuts are rarely sudden surprises — the warning signs are in the data. Rising payout ratios, declining free cash flow, or weakening earnings are early signals that most investors miss because they’re not tracking the right metrics.
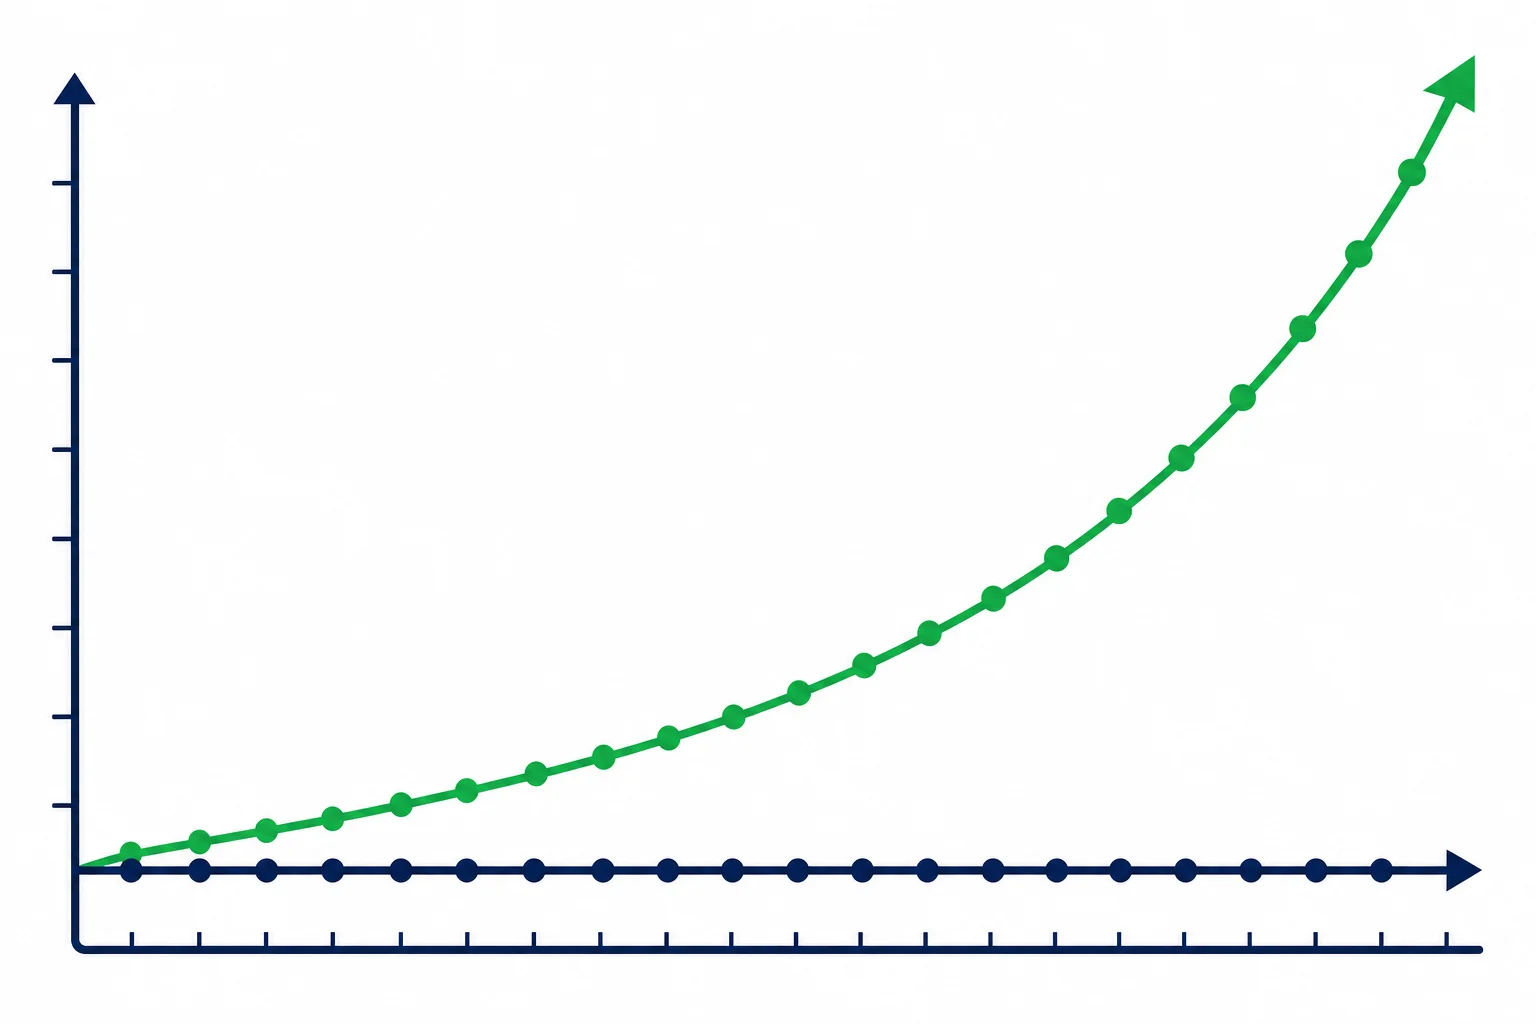
The mathematics of dividend reinvestment are simple — and staggering. When you reinvest dividends to purchase additional shares, those new shares generate their own dividends, which purchase more shares, which generate more dividends. Over time, this feedback loop creates a compounding machine that does most of the heavy lifting for you.
Dividend Reinvestment Plans (DRIPs) automate this process, purchasing fractional shares at each payment date without requiring action on your part. But the real challenge isn’t automation — it’s visibility. Most investors have no clear picture of how much their reinvestment activity is contributing to their total wealth, which positions are benefitting most, or whether their reinvestment pace aligns with their long-term income goals.
Reinvesty solves this by tracking every DRIP transaction, calculating its compounding effect, and projecting your forward income based on your current reinvestment rate. Small income streams, consistently reinvested, grow into something substantial.

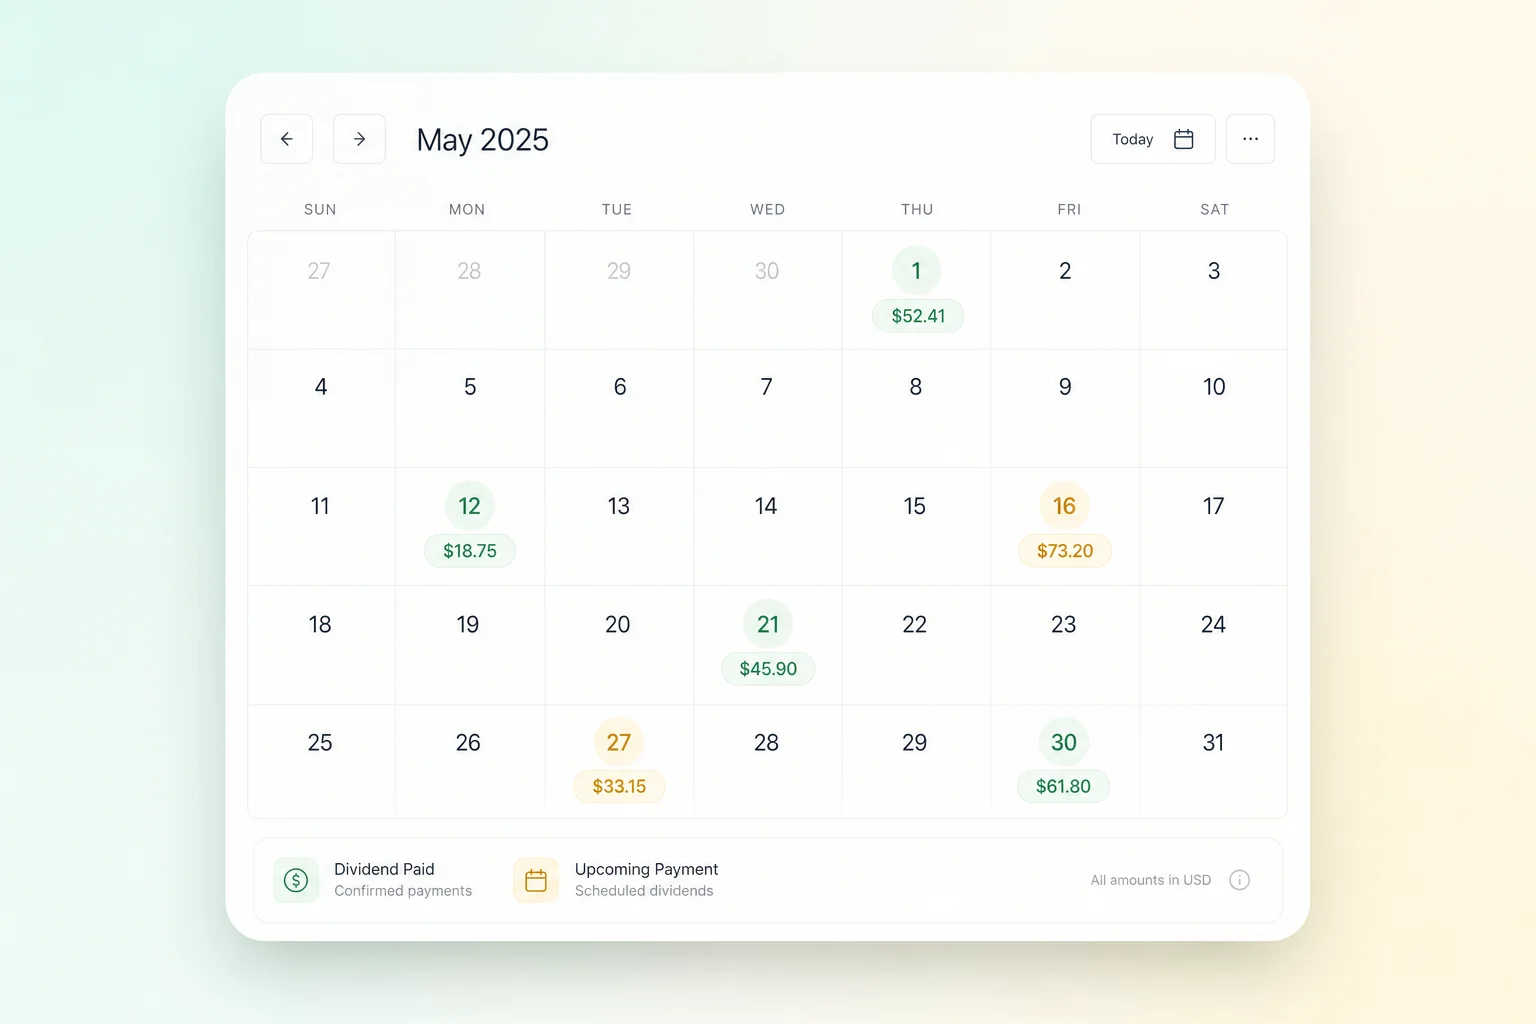
Cash flow visibility transforms dividend investing from passive to intentional. Reinvesty’s income calendar shows you every payment — past, pending, and forecasted up to three years ahead.
See projected dividend income across the next 36 months based on current holdings, announced payouts, and estimated payment schedules. Plan your financial life around real cash flow — not guesses.
Every dividend is categorized as paid, pending, announced, or estimated. Never wonder whether a payment has arrived or is still in transit — especially useful when holdings span multiple share registries.
Visualize which months generate heavy income and which are lighter. Investors living on dividend income use this to smooth spending, plan large purchases, and avoid surprises during low-income periods.
Income across taxable accounts, IRAs, and other holdings shown in a single unified calendar. No more switching between brokerage apps to piece together your total income picture.
One of the most common mistakes dividend investors make is optimizing entirely for yield — chasing the highest-paying stocks without accounting for price appreciation, or worse, accepting declining share prices in exchange for high income.
A 5% yield with zero price growth returns 5%. A 1.5% yield with 10% annual appreciation returns 11.5%. A diversified dividend portfolio accounts for both dimensions — blending high-yield, stable payers for current income with lower-yield, high-growth dividend growers for capital appreciation over time.
Reinvesty displays total return prominently alongside income metrics, ensuring you always have the complete picture. Income is a feature. Total return is the goal.
| Holding Type | Yield | Price Growth | Total Return |
|---|---|---|---|
| High-yield, stable payer | 5.0% | 0% | 5.0% |
| Low-yield, high-growth | 1.5% | 10% | 11.5% Better |
| Balanced blend | 3.0% | 6% | 9.0% Balanced |

Dividend income is taxed — but not all dividends equally. The difference between ordinary and qualified dividend treatment can mean the difference between a 37% tax rate and a 0%, 15%, or 20% rate on the same payment. Over a multi-decade investing career, tax efficiency is one of the highest-leverage improvements available.
Reinvesty tracks qualified vs. ordinary dividends automatically, helping you understand your real after-tax income and make smarter account placement decisions — keeping the right assets in taxable accounts versus tax-advantaged retirement accounts.
Taxed at long-term capital gains rates (0%, 15%, or 20% depending on income). Must meet holding period requirements. Generally paid by U.S. corporations and qualified foreign corporations.
Taxed as regular income — up to 37% for top earners. Typically paid by REITs, MLPs, money market funds, and certain foreign corporations. Best held in tax-advantaged accounts when possible.
International dividend holders often have taxes withheld at the source. Reinvesty tracks foreign withholding so you can claim the Foreign Tax Credit and avoid paying twice on the same income.
The best dividend tracking doesn’t just record what happened — it helps you decide what to do next. Reinvesty turns your data into a roadmap.
Start with a concrete goal — a monthly income number that covers your expenses, supplements your salary, or ultimately replaces it entirely. Reinvesty’s projection engine shows you exactly how your current portfolio trajectory maps to that target, and what changes would accelerate it.
The best dividend investments share a recognizable profile: low debt, steady free cash flow, conservative payout ratios, and a track record of growing payments through economic cycles. Reinvesty surfaces these characteristics across your holdings so underperformers can be replaced with stronger dividend growers — building toward 7–8% annual income growth.
Smart reinvestment isn’t just turning dividends back on automatically — it’s directing capital toward the positions with the strongest combination of yield, growth, and safety. Reinvesty’s data-driven recommendations help you make reinvestment decisions based on fundamentals, not gut feel or recency bias.

Connect your accounts and let Reinvesty handle data entry automatically. Dividends, DRIP purchases, and share transactions logged in real time — no spreadsheet maintenance required.
See your true return on original capital — the metric that reveals how dramatically your income has grown since your initial investment, independent of today’s market price.
A visual, filterable calendar of every past, pending, and projected dividend payment. Plan your cash flow up to three years ahead with confidence.
Model your portfolio’s future income at 1%–15% annual growth rates over 5, 10, 15, and 20-year horizons. See exactly how your current trajectory maps to financial independence.
Qualified vs. ordinary dividends tracked automatically. Foreign withholding documented. Tax season becomes a straightforward export rather than a multi-day reconciliation.
Early warning signals when payout ratios, free cash flow, or dividend growth rates shift in ways that historically precede cuts. Know before the rest of the market does.
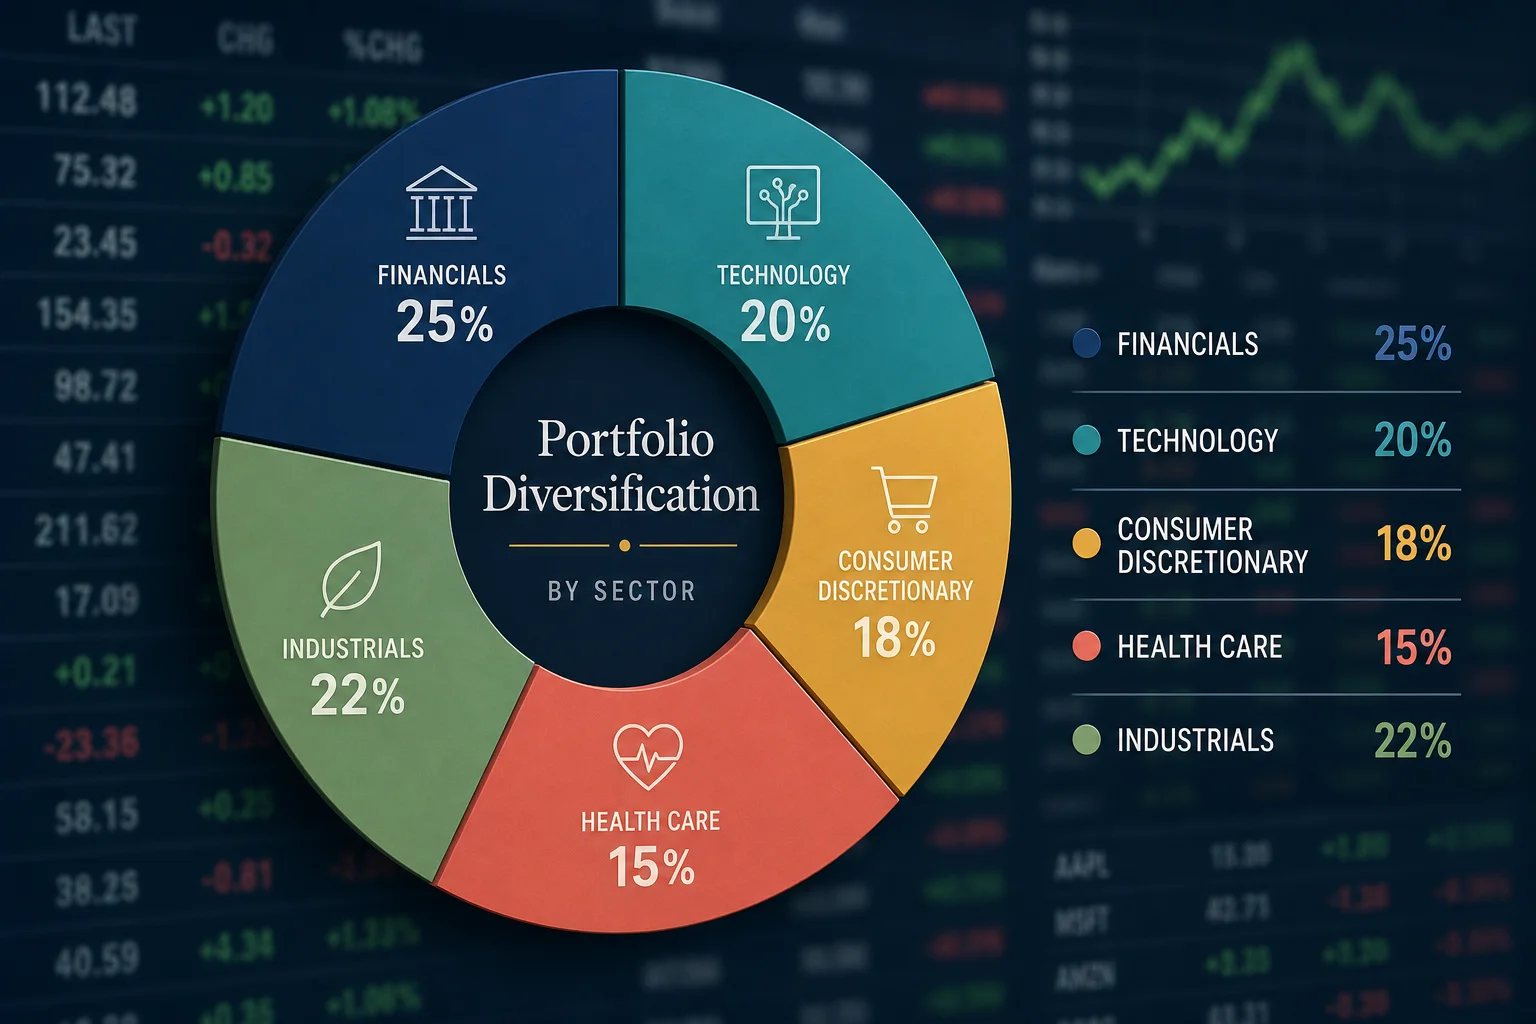
A clear visual of your portfolio’s sector exposure, ensuring no single position dominates your total income — a key discipline in building a resilient, all-weather dividend portfolio.
Full portfolio visibility on any device. Check your income calendar, review incoming payments, and track reinvestment performance wherever you are.
Income and price appreciation tracked side by side. Always know your real wealth creation numbers — not just the yield headline that can mask a deteriorating position.
Every untracked payment, every missed reinvestment signal, every ignored payout ratio shift is compounding cost. Reinvesty gives you the visibility and tools to make every dollar of dividend income work harder.
Available on iOS and Android.